Day Trade For Living, Andrew Aziz [bill gates books to read .txt] 📗

- Author: Andrew Aziz
Book online «Day Trade For Living, Andrew Aziz [bill gates books to read .txt] 📗». Author Andrew Aziz
lno e.u lng ;
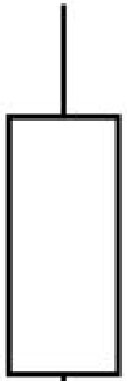
Bullish Candle Stic:k
High
Open
!.,ow
Decir easlng :
18 - ri:.h Cand le St i,c;k
H ig h
Open
Low


Candlestick Examples
Compared to other forms of representing price action, many traders consider candlestick charts more visually appealing and easier to interpret. Each candlestick provides an easy-to-decipher picture of price action. A trader can immediately compare the relationship between the open and close as well as the high and low. The relationship between the open and close is considered vital information and forms the essence of candlesticks.
Here is my ninth day trading rule:
Rule 9: Hollow candlesticks, where the close is greater than the open, indicate buying pressure. Filled candlesticks, where the close is less than the open, indicate selling pressure.
Traders can be divided into three groups: buyers, sellers, and the undecided . Buyers want to pay as little as possible and sellers want to
charge as much as possible. Their permanent conflict is reflected in bid ask spreads. "Ask" is what a seller asks for merchandise. "Bid" is what a buyer offers for that merchandise. Prices are created by masses of traders
-buyers, sellers, and undecided people. The patterns of prices and volume reflect the mass psychology of the markets. The goal of a successful day trader is to discover the balance of power between buyers and sellers and bet on the winning group. Fortunately, candlestick charts reflect this fight in action. A successful day trader is a social psychologist armed with a computer and charting software. Day trading is the study of mass psychology.
The presence of undecided traders puts pressure on bulls and bears. Buyers and sellers move the prices fast because they know that they're surrounded by a crowd of undecided traders who could step in and snatch away their deal at any moment. Buyers know that if they think too long, another trader can step in and buy ahead of them. Sellers know that if they try to hold out for a higher price, another trader might step in and sell at a lower price. The crowd of undecided traders makes buyers and sellers more willing to deal with their opponents.
Buyers are buying because they expect prices to rise. Sellers are selling because they expect prices to fall. Buying by bulls pushes markets up, or as I phrase it, "Buyers are in control." Selling by bears pushes the markets down, or as I express it, "Sellers are in control." Undecided traders make everything happen faster by creating a sense of urgency among buyers and sellers.
Candlesticks tell us a great deal about the general trend of a stock and the power of buyers or sellers in the market. Candles are always born neutral. After birth, they can grow to become either bearish, bullish or, on rare occasions, neither. When a candle is born, traders do not know what it will become. They may speculate but they do not truly know what a candle is until it dies (closes). After a candle is born, the battle begins. The bulls and the bears fight it out, and the candle displays who is winning. If buyers are in control, you will see the candle move up and form a bullish candle. If sellers are in control of the price, you will see the candle move down and become a bearish candle. You may be thinking that this is all very
obvious, but many traders don't see candles as a fight between buyers and sellers. That little candle is an excellent indicator that tells you who is currently winning the battle, the bulls (buyers) or the bears (sellers).
Candles with large bodies toward the upside , like the figure below, are very bullish. As you can see, it means that the buyers are in control of the price action, and it is likely that they '11 keep pushing the price higher. The candle not only tells you the price, it tells you that the bulls are winning and that they have power.
I
I
Bullish Candles
A series of bullish candles shows bulls (buyers) are in control of the price.
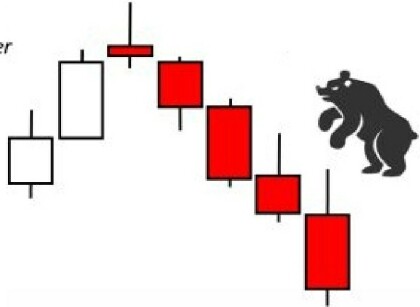
On the other hand, bearish candles are any candles that show a bearish body. So what does the bearish candle tell you? It tells you that the sellers are in control of the price action in the market. It tells you that the sellers are currently in control, so buying or a "long" position would not be a great idea.
Red candles that have this big red body mean the open was at a high and the close was at a low This is a good indicator of a bearishness in the market.
I
I I
Bearish Candles
ttO,
-
it,:tt

••
111 cby 0 • Y
'
tt t U:..» lll:.al JIJ 1u, UJNI 110 11:,a 1,-!I, .GIi Pt.:11 1.1:IS
- - - □ - - l ■D §
11.n
II.JI
l■-11
II
1■-1,
11-"
,11.,•1.
11.D
II
II.JC
11.H
II.JO
A series of bearish candles shows bears (sellers) are in control of the price.
Just by learning to read candlesticks, you will begin to generate an opinion on the general attitude for a stock. This is called "price action". Understanding who is in control of the price is an extremely im portant skill in day trading.
A major goal of a serious day trader is to discover the balance of power between bulls and bears and to bet on the winning group. If bulls are much stronger, you should buy and hold. If bears are much stronger, you should sell and sell short. If both camps are about equal in strength, wise traders stand aside. They let the bulls and the bears fight with each other and enter trades only when they are reasonably certain which side is likely to win.
You never want to be on the wrong side of the trade. It is important therefore to learn how to read candlesticks and how to constantly interpret the price action while you are trading .
There are hundreds of im aginati vely -named chart patterns that you will find with a Google search including Head-and-Shoulders, Cup-and Handle, Abandoned Baby, Dark Cloud Cover, Downside Tasuki Ga p,
Dragonfly, Morning Star, Evening Star, Falling Three Methods, Harami, Stick Sandwich, Three Black Crows and Three White Soldiers. Believe me, I did not make any of these names up. These candlesticks are really out there. As intriguing as their names might be, many of them, in my opinion, are useless and confusing. Therefore, I skip discussing most of them in this book.
In my opinion, trend lines and most charting patterns are quite subjective, and can result from wishful thinking and self-deception. You can draw a trend line across any prices or zones in a way that can change its slope and its message. If you're in a mood to buy, you can draw your trend line a little steeper. If you feel like shorting and squint at a chart, you'll "recognize" a Head-and-Shoulders Pattern. None of those patterns are objective, and I am skeptical of claims regarding even classical formations, such as Cup-and-Handle and Head-and-Shoulders. The biggest pitfall with this kind of pattern charting is wishful thinking. Traders will find themselves identifying bullish or bearish patterns depending on whether they 're in a mood to buy or sell.
In the next section, I'll give you a quick overview of the two most important patterns for day trading (spinning tops and Dojis) and then, in Chapter 7, I will explain how you can trade using these patterns.
Spinning Tops
Spinning tops are candles that have similarly-sized high wicks and low wicks that are usually larger than the body and will often be a little bit more indecisive. For the sake of poetry, let's call them candles of indecision. In these candlesticks, the powers of the buyers and the sellers are almost equal. Although no one is in control of the price, the fight continues on. Usually the volume is lower in these candlesticks as traders are waiting to see who wins the fight between the sellers and the buyers. Trends in price can change immediately after indecision candles and they therefore are important to recognize in the price action.
-[
Buying and selling pressure definition on spinning top candlestick.
bullish spinning
top
bearish spi'm ng top1
Formation of spinning top candlestick for reversal trends.
Dojis: Simple, Shooting Star, and Hammer
Dojis are another important candlestick pattern and come in different shapes and forms but are all characterized by having either no body or a very small body. A Doji is also an indecision candlestick that is similar to a spinning top. When you see a Doji on your chart, it means there is a strong fight occurring between the bears and the bulls. Nobody has won the fight yet.
+Doji
indecision
Buyers tr i ed 'to, p u ,sh the 1Pr i ce up,
b ut did no,t manage t,o h o ld at
Indecision,sellers may takecontrol
Se lle rs t rie d to pu:s h th e price clo wn,
but did not ma1n ageto hold it
Harnme,r Doji
fndecision, buyers may take control
Examples of Doji candlesticks.
In the picture above, a Doji tells us the same story as a spinning top does. In fact, most indecision (reversal) candles tell you basically the same thing. This will be discussed in greater detail in the next section.
At times Dojis have unequal top and bottom wicks. If the top wick is longer, it means that the buyers tried unsuccessfully to push the price higher. These types of Dojis, such as the shooting star, are still indecision candlesticks, but they may indicate that the buyers are losing power and that the sellers may take over.
If the bottom wick is longer , as in hammer Dojis, it means that the sellers were unsuccessful in trying to push the price lower. This may indicate an impending take over of price action by the bulls.


Boa in control
Sell erspush lower
Hamm er Doji
fndecision
0

Bulls in c-0ntrol
Bvyers push higher
Bottom Reversal Strategy with an indecision hammer candlestick formed as sign of entry.
All Dojis indicate indecision and possible reversals if they form in a trend. If a Doji forms in a bullish trend, it suggests that the bulls have become exhausted and the bears are fighting back to take control of the price. Similarly, if a Doji forms in a bearish downward trend, it suggests that the bears have become exhausted and the bulls (buyers) are fighting back to take control of the price.
Brulls in contro'I
90
Shooting Star Dojii
Indecision
!Bearsi n cont11ol
Sellers push lowe r
Top Reversal Strategy with an indecision Shooting Star candlestick formed as sign of entry.
After learning these candlesticks, it is important that you not get too excited too quickly. Candles are not perfect. If you take a trade every time you see a Doji formed in a trend, you will end up with significant losses. Always remember that these candles only indicate indecision and not a definite reversal. To use indecision candles effectively, you must look for confirmation candles and ideally use them with other forms of analysis such as support or resistance levels, both of which are explained in Chapter 7.
Chapter 7:


Comments (0)